
Are AI data centers heating their surroundings? Fact-checking the 340 million study
This spring, the claim was that AI data centers warm the land within ten kilometers by 2 °C, affecting 340 million people. A peer-reviewed study from Japan now reaches a different conclusion, and basic physics already argues against the number. We compared both papers, re-ran the energy balance and gathered what local heating has actually been measured.
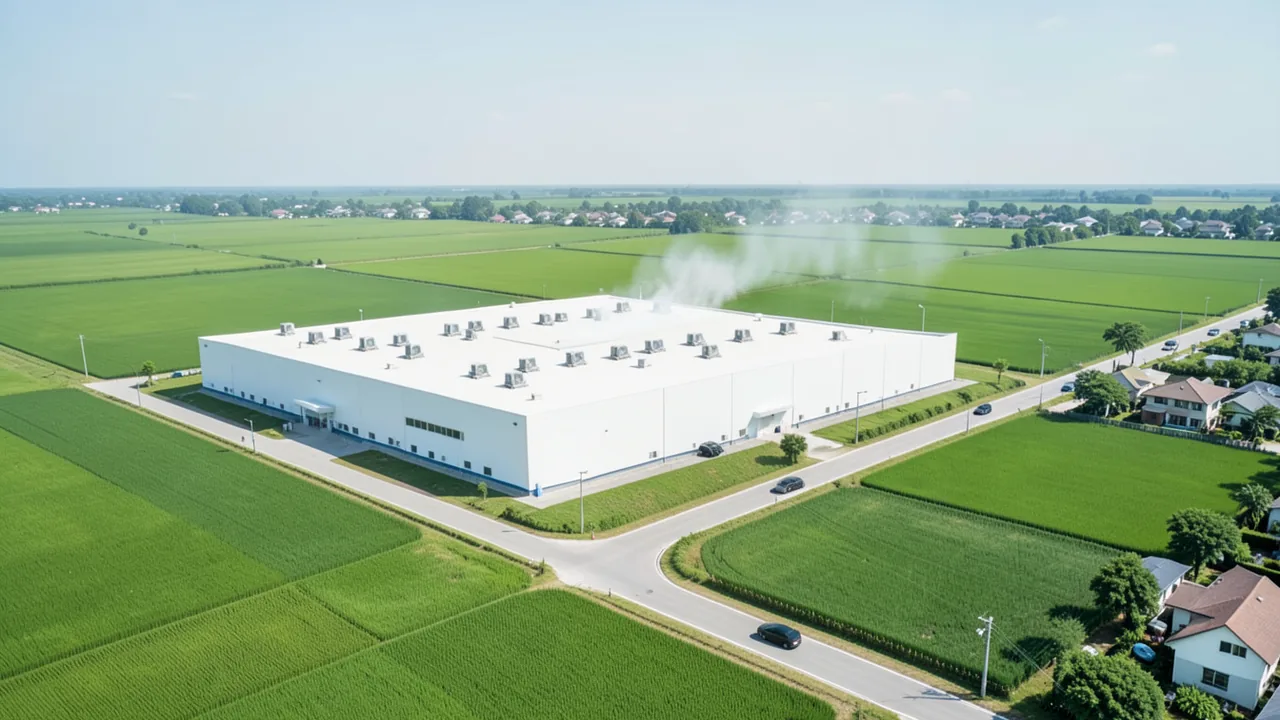
What this is about
In late March 2026, a paper titled “The data heat island effect” appeared on the preprint server arXiv. Preprint means the study was published before other experts reviewed it. The lead author is Andrea Marinoni (University of Cambridge), with eight co-authors from Singapore, Grenoble, Genoa and Hong Kong. Its claim went around the world: once an AI data center comes online, the surrounding area warms by 2 °C on average, by as much as 9.1 °C in extreme cases, and up to ten kilometers away. More than 340 million people are said to be affected. CNN picked it up, and in German-speaking media, so did Winfuture (“Millions affected: data centers heat up their surroundings,” March 31), Computerwoche (“AI data centers can heat their surroundings by up to 9 degrees,” April 1) and t3n (April 6), among others.
On November 4, a peer-reviewed counter-study appeared in the journal Environmental Research Letters. It reaches a markedly different result. We compare both papers, roughly re-run the energy balance and bring in a third study from Phoenix, the only one that measured the air directly.
What the Cambridge study actually measured
The basis is the DataCenterMap location database with more than 11,000 entries. Of those, 8,472 lie outside densely built cities. After cleanup, the paper says “over 6,733 data points” remain. The paper doesn't clearly state how many individual facilities that represents; CNN spoke of “more than 6,000 data centers.” The temperature data comes from a reconstructed dataset from NASA's MODIS satellite instrument, with a resolution of about 500 meters, covering 2004 to 2024.
The method is simple: for each site, the temperature in the month the facility came online is compared with the average of the preceding 60 months. That yields a mean of 2.07 °C, with most sites between 1.5 and 2.4 °C. The 9.1 °C is the highest value at any single site. The effect fades with distance: according to the paper, it's still at 30 percent strength within 7 km, and about 1 °C out to 4.5 km.
Here's where the 340 million comes from: the authors count everyone living within 10 km of a data center and sort them by measured warming. The text says “up to 343 million.” Blogger Andy Masley points out that the 10 km circles overlap and that the number doesn't demonstrate any actual harm.
Three weaknesses stand out:
- There's no control group. The study only compares each site with its own past. It doesn't check whether a new warehouse or parking lot on the same field would have produced the same jump.
- It isn't just about AI. The database includes data centers of every kind. According to Peter Judge of the Uptime Institute, facilities in the dataset are typically 10 to 20 megawatts and mostly predate the AI boom.
- Nothing has changed. In our research, we found neither a peer-reviewed version nor a public response from the authors to the criticism. The latest arXiv version is dated April 21.
Surface is not air
The most important point gets lost in many headlines. What was measured is land surface temperature (LST): the temperature a satellite derives from the thermal radiation of roofs, asphalt or meadows. The air temperature two meters above ground, which people actually feel, is something else. An asphalt lot in the midday sun can be dozens of degrees hotter than the air above it. A talk from urban climate research at a German federal conference in 2023 cites differences of “several tens of K” between surface and 2 m air temperature, even within a single city. A paper from the German Society for Photogrammetry notes that what matters for heat islands is the air temperature between buildings, not the surface temperature.
To be fair: Computerwoche, t3n and Winfuture did mention surface temperature in their articles. Computerwoche also quoted Vlad Galabov of market research firm Omdia, who attributes most of the effect to changes in land use. The headlines, however, talked about the “surroundings.” So far, we haven't found any German-language follow-up coverage of the new counter-study.
The counter-study from Japan
The new paper comes from Jiawei Jing (Makuhari Development Corporation, Chiba), its sole author. The study is open access and examines the Inzai and Tama data center clusters near Tokyo, Japan's largest concentration of such facilities. It analyzes 12 facilities built between 2011 and 2025, over 13 years, using three satellite systems: Landsat (100 m, daytime only), ECOSTRESS (70 m, day and night) and MODIS (1 km).
Unlike the Cambridge paper, Jing compares against control areas: seven matched comparison sites, four industrial roofs that existed before 2013 and three rice paddies. An old data center in Tama serves as an additional cross-check. The timeline is split into three phases: before construction, during construction and in operation. The key results:
- During the day, the surface cooled by 1.8 to 2.2 °C after the facilities came online. Jing attributes this to bright roofs that reflect more sunlight than the farmland that was there before. He acknowledges that a measurement artifact partly exaggerates the cooling.
- At night, directly over the facilities, changes ranged from −0.15 to −0.23 °C and were not statistically significant. However, the method can't reliably rule out smaller warming of up to about 0.6 to 1.2 °C.
- At night, measured across the whole cluster, there was an increase of 0.20 °C. Jing attributes this to heat that buildings store during the day and release in the evening.
- Comparisons in other climate zones are in the appendix, though only at the coarse 1 km resolution: in DeKalb (Illinois), three-quarters of the nighttime warming occurred during construction, before any servers were running. At a 143 MW campus near Phoenix, nighttime temperature rose by 0.79 °C, again already during construction. Nearby new buildings without a data center came in at 0.49 to 0.69 °C.
Jing lists his own limitations: only two clusters in a humid temperate climate, few nighttime images before construction (eight scenes) and no transferability to gigawatt-scale campuses. He, too, mostly measures surface temperature. Atmospheric scientist Marshall Shepherd criticizes in Forbes that the study's weather stations are on average 17 km apart and that the satellite resolution is coarse. He advises against basing policy on one or two studies. The article page has no conflict-of-interest statement; it only says there was no external funding. We couldn't determine whether Jing's employer does business with data centers. The code and control areas are openly available on Zenodo.
| Cambridge (Marinoni et al.) | Tokyo (Jing) | Phoenix (Sailor et al.) | |
|---|---|---|---|
| Status | Preprint, not peer-reviewed | Peer-reviewed, ERL, Nov 4, 2026 | Peer-reviewed, ASME journal |
| Metric | Surface temperature | Mostly surface temperature | Air temperature at 1.6–2.2 m height |
| Scope | Over 6,700 data points worldwide | 12 facilities, 13 years | 4 facilities (36–169 MW), June–Oct 2025 |
| Comparison | Own past | 7 control areas + cross-check | Upwind vs. leeward, measured simultaneously |
| Result | +2.07 °C on average, up to 10 km | Day −1.8 to −2.2 °C, night < +0.3 °C | +0.7 to 0.9 °C, peak 2.2 °C, up to approx. 500 m |
Running the numbers: where would the degrees come from?
In his central scenario, Jing assumes about 560 MW of waste heat for the entire Inzai cluster, based on a PUE of 1.4. PUE is the ratio of total power to IT power, so here an extra 40 percent goes to cooling and infrastructure. Spread over about 10 km², that's roughly 56 W/m². A simple air model with wind and mixing yields at most 0.05 °C of warming during the day and 0.35 °C at night. Reaching 2 °C would take 322 to 2,412 W/m², or 6 to 43 times as much.
Andy Masley, in his blog (not peer-reviewed), arrives at a similar picture. A 100 MW data center whose heat spreads over a circle with a 1.6 km radius delivers at most 12.5 W/m². Keeping the ground 1.5 °C warmer permanently would take about 15 W/m². Masley assumes that only 2 to 5 percent of the waste heat reaches the ground at all, though he doesn't back up that share. That gets him to 0.02 to 0.05 °C.
Our back-of-the-envelope math: A circle with a 10 km radius covers about 314 km². We generously assume 10 W/m² per degree, roughly the heat input an area needs to stay one degree warmer, since it keeps losing heat to air and wind. For 2 °C, that's 20 W/m², or about 6.3 gigawatts of continuous power across the whole area. A typical 10 to 20 MW facility delivers only one three-hundredth to one six-hundredth of that. Even the “1 °C out to 4.5 km” would require about 640 MW. For comparison: on a clear summer midday, about 1,000 W/m² of solar radiation hits the ground. Whether an area sits in the sun as farmland, a dark parking lot or a bright roof therefore matters far more than server waste heat.
Our assessment: the Cambridge study's satellite readings aren't necessarily wrong. But physics argues against them being caused by waste heat. More plausible culprits are sealed surfaces, roofs, parking lots and other buildings that often spring up around new data centers.
The middle ground: driving surveys in Phoenix
That data centers can still noticeably warm their immediate neighborhood is shown by David Sailor, Soroush Samareh Abolhassani and Eli Martin of Arizona State University. Their paper appeared in the Journal of Engineering for Sustainable Buildings and Cities. Between June 18 and October 25, 2025, cars fitted with fast-response temperature sensors drove around four air-cooled data centers ranging from 36 to 169 MW, measuring the upwind and leeward sides at the same time. The sensors were mounted 1.6 to 2.2 m above the ground and recorded every two seconds.
The result: on the downwind side, the air was on average 0.7 to 0.9 °C warmer, peaking at 2.2 °C. On June 18, for example, a facility in Chandler showed 42.7 °C on the upwind side versus 43.5 °C in the residential area behind it. The effect was measurable up to about a third of a mile (roughly 500 m) from the site. The reason is the design: the dry coolers, which use fans to dump heat into the outside air, blow out air that ASU says is 14 to 25 °F (about 8 to 14 °C) warmer than its surroundings. Sailor puts the figure for the building footprint itself at 2,000 to 6,000 W/m². So close to the facility, the waste heat is highly concentrated; spread over square kilometers, it quickly becomes weak.
The authors call their data initial observations and stress that more measurements are needed. Sailor expects “even more pronounced impacts” under other weather conditions. Jing sees no contradiction with his work: his estimate also allows for a few degrees within a few hundred meters, and less than 1 °C from about one kilometer out.
What this means for Germany
In Germany, waste heat is mainly a question of wasted energy. The Energy Efficiency Act requires new data centers to reuse 10 percent of their waste heat, rising later to 15 and 20 percent. The amendment the federal cabinet approved on June 24, 2026, keeps these quotas. According to Cloudmagazin, however, it introduces new exemptions and turns the general obligation to avoid or use waste heat into a cost-benefit test. The obligation to inform district heating operators is dropped. Municipal associations have criticized this.
Frankfurt shows what's possible. The Rhine-Main region has more than 1,100 MW of data center capacity. In Hattersheim, Mainova and NTT Data have been supplying more than 600 households with server heat since late 2024, using heat pumps to raise it from about 30 to 70–75 °C. Up to 20 MW is planned with Digital Realty in Fechenheim. The new “franky” neighborhood in Gallus is set to get at least 60 percent of its heat from a data center. Ralph Hintemann of the Borderstep Institute estimated in 2023 that up to 6 billion kWh of waste heat per year could be usable by 2035, enough for up to 600,000 homes.
Our take
Established: air is warmer on the downwind side of air-cooled data centers, by less than 1 °C on average and just over 2 °C at peak, over a few hundred meters. That fits the physics, and residents right next to large dry coolers may notice it on hot days. It's also well founded that any large sealed surface changes the ground temperature, whether it's a data center or a warehouse.
Not established: this spring's headline that AI data centers heat the land within ten kilometers by 2 °C and affect 340 million people. The number is based on surface temperatures without a control group. As far as our research shows, the paper is still not peer-reviewed, and the required amount of heat exceeds the waste heat many times over.
Still open: quite a lot. The counter-study has a single author tied to a company, looks at just one climate and also mostly measures surfaces. Its findings explicitly don't apply to future gigawatt campuses with their own gas turbines, which the Uptime Institute warns about. Our assessment: if you want to argue about heat in permitting processes, talk about dry coolers, setbacks, green buffers and waste heat reuse. The 340 million figure isn't a solid argument for any of that.
Sources
- Environmental Research Letters: Jing, Satellite observations and energy balance constrain the thermal footprint of a hyperscale data-centre cluster iopscience.iop.org
- IOP Publishing: Pressemitteilung zur Gegenstudie ioppublishing.org
- Phys.org: Satellite analysis finds little evidence that data centers cause widespread ground warming phys.org
- arXiv-Preprint 2603.20897 (Marinoni u. a.) arxiv.org
- arXiv HTML v3 des Preprints arxiv.org
- Andy Masley: Data centers' heat exhaust is not … blog.andymasley.com
- Uptime Institute: Data centers face new scrutiny over heat island effect journal.uptimeinstitute.com
- ASU News: Turning down the heat from data centers news.asu.edu
- Gigazine: Data center waste heat downwind gigazine.net
- Yahoo/Forbes (Marshall Shepherd): Do Data Centers Cause Heat Islands? A New Study Says No yahoo.com
- The Register: AI datacenters create heat islands around them, paper finds theregister.com
- CP24/CNN: Scientists have found an alarming environmental impact of vast data centres cp24.com
- Computerwoche: KI-Rechenzentren können Umgebung um bis zu 9 Grad aufheizen computerwoche.de
- Winfuture: Datenzentren heizen ihre Umgebung auf winfuture.de
- t3n: KI-Rechenzentren heizen Umgebung auf t3n.de
- Cloudmagazin: EnEfG-Novelle lockert Pflichten für Rechenzentren cloudmagazin.com
- Cleanthinking: Rechenzentren-Abwärme in Frankfurt cleanthinking.de
- Borderstep: Hintemann, Nachhaltigkeit von Rechenzentren (2023) borderstep.de
- DGPF-Tagungsbeitrag zu Oberflächen- und Lufttemperatur dgpf.de
- Impulsvortrag Stadtklima, Bundeskonferenz 2023 gesund-aktiv-aelter-werden.de
Ask the AI assistant
Questions about this article, installation or background? Our assistant knows this page and runs on our own machine, not in someone else's cloud.
The Assistant is an AI (Gemma 4) and can make mistakes – please check important details against the source. Questions are used only to generate an answer and are deleted after one hour. Please don't enter any personal data.



Comments
What do you think? Already tried it? Write it here, no sign-up needed.
Comments are public. Links aren't allowed, and we delete abusive posts. You can delete your own comment at any time in this browser. Learn more in the Privacy Policy.