
Google AI spots high blood pressure from a smartwatch, no cuff required
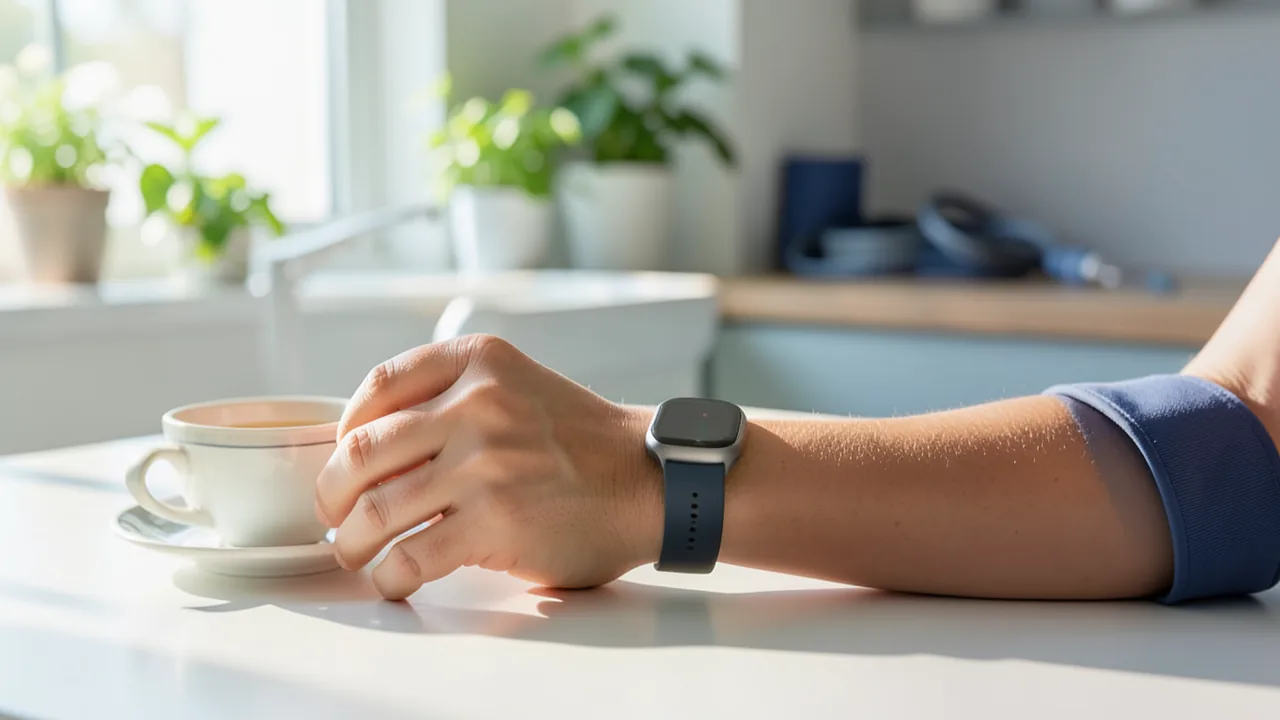
In Nature, Google Research has unveiled an AI model that finds signs of high blood pressure using only the pulse and motion sensors of an ordinary smartwatch, with no calibration against a blood pressure cuff. In a study of 196 people, the watch performed about as well as an in-office measurement. But it doesn't give you a blood pressure reading, and it doesn't replace a diagnosis.
What's going on
High blood pressure causes no symptoms for a long time. According to Google, more than half of those affected don't know they have it. Google Research and partners have now published a study in the journal Nature: an AI model is supposed to detect signs of high blood pressure using a perfectly ordinary smartwatch. It doesn't need a blood pressure cuff for calibration. The model uses only two sensors that modern watches already have: an optical pulse sensor and a motion sensor. Google published its accompanying blog post on November 5, 2026, and The Decoder reported on it on November 7.
It's important to understand what the model can't do. According to the tech blog explainx.ai, it isn't a cuffless blood pressure monitor. The watch won't show a reading like "128 over 82." It estimates how likely someone is to have persistently elevated blood pressure, and is meant to nudge them to get checked by a doctor. In the paper, the model is called "AI-PPG-ACC-HTN," and the study is titled "Opportunistically Detecting Signs of Hypertension on a Consumer Smartwatch" (first author Paolo Di Achille, with contributors including Ming-Zher Poh).
How the watch gets by without a cuff
Previous attempts to measure blood pressure with wearables mostly tried to calculate a specific number. To do that, they had to be calibrated regularly with a cuff, meaning aligned to a real reading. Google asks a simpler question: does this person have persistently elevated blood pressure? A single pulse signal at the wrist is very imprecise. The average pattern over several days, on the other hand, is far more stable.
The two sensors deliver different signals:
- Photoplethysmography (PPG): The pulse sensor shines light into the skin and measures how the volume of blood in tiny vessels changes with each heartbeat. That produces a pulse waveform.
- Accelerometer: It picks up the tiny recoil your body makes with each heartbeat. Experts call this a ballistocardiogram.
According to Google, the analysis runs in two stages. First, a neural network learned from 492,347 hours of sensor data from 2,109 people. The data was split into overlapping 15-second segments. The network had to figure out which segments came from the same person. This approach is called self-supervised or contrastive learning: it doesn't need diagnoses as labels. But to tell people apart, the network had to learn stable, personal features of their pulse and heartbeat.
In the second stage, the system averages these features over several days of wear. Together with body height, they feed into a simple statistical model, a regularized logistic regression. Height serves as a proxy for arterial length, which affects how fast a pulse wave travels through the body. The output is a probability of high blood pressure.
What the study shows
The model was tested in a prospective study at five US centers with 196 participants. Prospective means the data was freshly collected specifically for this test. Participants had no known cardiovascular disease and weren't taking blood pressure medication. The reference was 24-hour ambulatory blood pressure monitoring, which Medical Xpress describes as the clinical gold standard. That's a tougher benchmark than a single in-office reading.
| Scenario | Method | Sensitivity | Specificity | Positive predictive value |
|---|---|---|---|---|
| Initial screening (196 people) | Smartwatch model | 65.8% | 90.0% | 80.6% |
| Initial screening (196 people) | In-office measurement | 55.3% | see text | 77.8% |
| Confirmatory test (48 people) | Smartwatch model | 78.4% | 90.9% | 96.7% |
| Confirmatory test (48 people) | Repeated in-office measurement | 67.6% | 63.6% | 86.2% |
| Confirmatory test (48 people) | Multi-day home monitoring | 89.2% | 81.8% | 94.3% |
Sensitivity tells you how many of the people who actually have the condition a test catches. Specificity tells you how many healthy people it correctly classifies as healthy. Positive predictive value tells you how often an alert is actually right. According to Medical Xpress, the watch's edge in sensitivity was not statistically significant, and both methods had a specificity of 90 percent. explainx.ai, by contrast, writes that Google's blog post gives no specificity figure for in-office measurement.
explainx.ai also flags an easily overlooked point: in the small confirmatory group of 48 people with elevated in-office readings, multi-day home monitoring caught the most cases, at 89.2 percent. The watch trailed at 78.4 percent. Its strength there was specificity, meaning few false alarms: 90.9 percent versus 63.6 percent for repeated in-office measurement.
In practice, this means: at 65.8 percent sensitivity, roughly one in three affected people in the study went undetected. So if the watch stays quiet, that's no all-clear. Conversely, about one in ten healthy people would get a false alert. That usually just costs a doctor's visit. According to explainx.ai, the watch's advantage lies elsewhere: it collects data without you having to do anything. A cuff only helps if you remember to use it.
What the AI looks for, and where its limits are
In an analysis, Google examined what the model pays attention to. Pulse waveforms associated with higher risk were slightly narrower, which could point to stiffer arteries. The waveform also rose more slowly, and features of the reflected pulse wave were altered. The ballistocardiogram showed characteristic deviations, too. These patterns match what clinicians associate with vascular stiffness. Google itself, however, describes these results as exploratory, meaning preliminary.
Google lists a number of limitations itself: this is early feasibility research. Sensitivity is only moderate, and the confirmatory group of 48 people is small. No external validation, meaning a check against independent data outside the study, is described. People with cardiovascular disease or on blood pressure medication weren't included. According to Medical Xpress, the authors stress that the system isn't meant to replace the classic cuff. It's meant to get people showing signs of high blood pressure to a diagnosis sooner.
What's already in products
According to The Decoder, the findings fed into the "Blood pressure trends" feature in the Google Health app. Google itself is more cautious, explainx.ai reports. The research "helped inform" the feature, but the methods described are not an indication of existing or upcoming product features. How much of the Nature model actually ends up in the app thus remains unclear.
The feature itself already exists. According to BGR, Google announced it in August alongside the Pixel Watch 5. According to gcn.com, it arrived via an update in September, free for Pixel Watch 3, 4 and 5, with the first reports surfacing in early October. Since version 5.11 of the Google Health app, it's also coming to the screenless Fitbit Air and the Fitbit Edge. For those, though, you need a Google Health Premium subscription at $9.99 a month or $99.99 a year. If you wear the watch for at least five consecutive days in a month, you get a report at the start of the next month. Google makes clear that the feature is for general wellness only. It's not meant for diagnosing high blood pressure, nor as a reason to change medication or treatment. The sources don't say whether or when it will be available in Germany.
Our take
The study stands out because it's more modest than most of the cuffless blood pressure promises of recent years. The watch delivers a warning signal, not a number. It was tested against a real clinical gold standard and published in one of the most prestigious journals. Technically, the recipe behind it is interesting: an AI first learns general patterns from lots of data without diagnoses. Then a small, painstakingly collected dataset with diagnoses is enough to build a test on top. Google uses the same approach for other health models such as SensorFM.
The limits are clear, though. With 196 participants, the study is small, a third of affected people are missed, and the edge over in-office measurement isn't statistically backed. If you own a Pixel Watch or a Fitbit, the feature can be a useful nudge to get your blood pressure checked. It doesn't replace a real measurement.
Sources
- The Decoder (EN) the-decoder.com
- The Decoder (DE) the-decoder.de
- Merkliste: explainx.ai explainx.ai
- gcn.com gcn.com
- bgr.com bgr.com
- medicalxpress.com medicalxpress.com
Ask the AI assistant
Questions about this article, installation or background? Our assistant knows this page and runs on our own machine, not in someone else's cloud.
The Assistant is an AI (Gemma 4) and can make mistakes – please check important details against the source. Questions are used only to generate an answer and are deleted after one hour. Please don't enter any personal data.

Comments
What do you think? Already tried it? Write it here, no sign-up needed.
Comments are public. Links aren't allowed, and we delete abusive posts. You can delete your own comment at any time in this browser. Learn more in the Privacy Policy.